Statistics, as a branch of mathematics, is a powerful tool that aids in the interpretation and understanding of numerical data. One of the fundamental concepts in statistics is the T-statistic, which plays a crucial role in hypothesis testing and regression analysis. This article aims to provide a simplified approach to understanding the T-statistic, its calculation, practical applications, common misinterpretations, limitations, and its role in stock market and factor analysis.
What is a T-statistic?
The T-statistic, often referred to as the Student’s T-test, is a type of statistic used to estimate the population parameter when the sample size is small and/or when the population variance is unknown. It was introduced by William Sealy Gosset, a chemist working for the Guinness brewery in Dublin, Ireland, under the pseudonym “Student.” The T-statistic follows a T-distribution, which is similar to the normal distribution but has heavier tails, providing a more accurate estimate when the sample size is small.
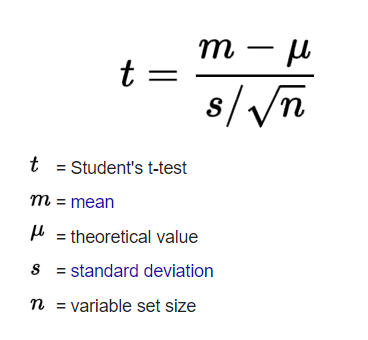
How is T-statistic calculated?
The ratio is calculated using the formula:

Practical use
In practical use, this metric is employed in various statistical tests, including the independent samples t-test. By comparing means, these tests determine whether there is a statistically significant difference between them. A researcher could compare the average scores of two student groups who received instruction from various methods using a t-test, for instance.
The T-statistic in factor analysis
In finance, notably in stock market analysis, the ratio is employed in regression analysis to estimate the importance of predictors. For example, when projecting stock prices, the T-statistic can be used to see if a particular element (such as the company’s earnings) has a substantial effect on the stock price. This can assist investors in making informed judgments regarding purchasing or selling stocks. T-stat, for example, is employed by our prediction model at AP to test for significance. In our newsletters, we assess each factor evaluated using P-value and T-Statistic.
Misinterpretations
Despite its usefulness, the metric can often be misconceived. A common fallacy is that a larger T-statistic always suggests a more significant effect. Nonetheless, the significance of a ratio also depends on the degrees of freedom and the significance level. It’s crucial to remember that the T-statistic is just one piece of the enigma in statistical analysis, and it should be wholly interpreted in the context of the study.
Limitations
The T-statistic, like any statistical metric, has limits. While using t-statistic as an indicator, it is assumed that the data has a normal distribution and that the sample was drawn at random. Furthermore, it may be less reliable when employed with high sample numbers or when the population variance is known. As a result, it’s critical to grasp these limits when employing the metric in research or data analysis.
The Impact on Decision-Making
The T-statistic, while a mathematical concept, has profound real-world implications, particularly in decision-making. In fields as diverse as healthcare, finance, and social sciences, decisions often hinge on the interpretation of statistical data where the T-statistic plays a key role. For instance, in clinical trials, the T-statistic can influence decisions about the efficacy of a new drug. As we mentioned above already, in finance, it can affect investment strategies.
As we become more data-driven, the importance of understanding and correctly interpreting the T-statistic and other statistical measures cannot be overstated. It emphasizes the need for statistical literacy, not just among researchers and professionals but also among the general public. And that’s why we wrote this article.
Regarding the theory: the ratio that is more than 2.0, or less than -2.0, is statistically significant. So if your T-value is not in this range, you are in the “statistically significant” region.
Conclusion
To summarize, the T-statistic is a diverse and strong statistical tool. It is utilized in a variety of applications ranging from hypothesis testing to stock market analysis. While it has limitations and is frequently misinterpreted, understanding this metric is critical for anybody interested in delving into the field of statistics. We can make better decisions, perform more accurate research, and obtain a better grasp of the world around us if we comprehend the T-statistic.